Manufacturing processes

For this project, the goal is to support a team aiming to enhance their control and monitoring of a manufacturing process. This involves implementing Statistical Process Control (SPC), a data-driven methodology to ensure product quality and consistent manufacturing performance. The task is to analyze historical data and use SQL queries to calculate control limits—upper control limit (UCL) and lower control limit (LCL)—to identify any anomalies in the process that require attention.
This acceptable range is defined by an upper control limit (UCL) and a lower control limit (LCL), the formulas for which are:
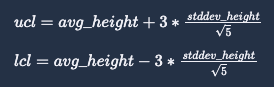
The UCL defines the highest acceptable height for the parts, while the LCL defines the lowest acceptable height for the parts. Ideally, parts should fall between the two limits.
To learn more about me and my work, expand the ABOUT ME section.
ABOUT ME
Learn more about me on my ABOUT page. Below, you can find links to explore more of my projects categorized by topics, access my resume, and contact me.| PROJECTS | RESUME | CONTACT |
Analyzing Manufacturing Process for SPC Implementation
Situation:
The team in charge of a manufacturing process wants to improve the way they monitor and control their workflow. They plan to introduce Statistical Process Control (SPC) to ensure that product quality remains consistent. The goal is to identify any anomalies in the product measurements (specifically height) that may require process adjustments. The data is available in the manufacturing_parts table which has the following fields:
item_no: the item numberlength: the length of the item madewidth: the width of the item madeheight: the height of the item madeoperator: the operating machine
Task:
I was tasked with analyzing the historical manufacturing data using SQL to calculate the Upper Control Limit (UCL) and Lower Control Limit (LCL) based on height measurements. By applying these limits, I was responsible for determining if any items in the process fall outside the acceptable range and require attention.
Action:
- I created a SQL query to calculate the average height and standard deviation of height for each product, using window functions to capture measurements over a sliding window of 5 items.
- I applied formulas to calculate the Upper Control Limit (UCL) and Lower Control Limit (LCL) for each group of 5 products.
- I flagged any items where the height fell outside these control limits (greater than UCL or less than LCL) using a CASE statement.
- I utilized SQL’s nested queries and window functions to handle the data efficiently and filter results for further analysis.
Here’s the SQL query used for this analysis:
1
2
3
4
5
6
7
8
9
10
11
12
13
14
15
16
17
18
19
20
21
22
23
24
25
26
27
28
29
30
31
32
33
34
35
36
37
38
39
40
41
42
43
44
45
46
47
48
49
50
51
52
53
54
55
56
WITH calculated_values AS (
    SELECT
        operator,
        item_no,
        height,
        AVG(height) OVER (PARTITION BY operator ORDER BY item_no ROWS BETWEEN 4 PRECEDING AND CURRENT ROW) AS avg_height,
        STDDEV(height) OVER (PARTITION BY operator ORDER BY item_no ROWS BETWEEN 4 PRECEDING AND CURRENT ROW) AS stddev_height,
        ROW_NUMBER() OVER (PARTITION BY operator ORDER BY item_no) AS row_number
    FROM
        manufacturing_parts
),
control_limits AS (
    SELECT
        operator,
        item_no,
        row_number,
        height,
        avg_height,
        stddev_height,
        (avg_height + 3 * stddev_height / SQRT(5)) AS ucl,
        (avg_height - 3 * stddev_height / SQRT(5)) AS lcl
    FROM
        calculated_values
    WHERE
        row_number >= 5 -- Exclude incomplete windows
),
alerts AS (
    SELECT
        operator,
        item_no,
        row_number,
        height,
        avg_height,
        stddev_height,
        ucl,
        lcl,
        CASE
            WHEN height > ucl OR height < lcl THEN TRUE
            ELSE FALSE
        END AS alert
    FROM
        control_limits
)
SELECT
    operator,
    row_number,
    height,
    avg_height,
    stddev_height,
    ucl,
    lcl,
    alert
FROM
    alerts
ORDER BY
    item_no;
Result:
The query successfully calculated the control limits for each batch of 5 items and identified any items that exceeded the Upper Control Limit (UCL) or fell below the Lower Control Limit (LCL). This allowed the team to pinpoint which steps in the process require adjustments to ensure product quality remains within acceptable bounds.
| operator | row_number | height | avg_height | stddev_height | ucl | lcl | alert | |
|---|---|---|---|---|---|---|---|---|
| 0 | Op-1 | 5 | 19.46 | 19.778 | 1.062812 | 21.203912 | 18.352088 | False |
| 1 | Op-1 | 6 | 20.36 | 19.912 | 1.090812 | 21.375477 | 18.448523 | False |
| 2 | Op-1 | 7 | 20.22 | 20.030 | 1.084574 | 21.485108 | 18.574892 | False |
| 3 | Op-1 | 8 | 21.03 | 19.934 | 0.931225 | 21.183369 | 18.684631 | False |
| 4 | Op-1 | 9 | 19.78 | 20.170 | 0.598832 | 20.973418 | 19.366582 | False |
| ... | ... | ... | ... | ... | ... | ... | ... | ... |
| 415 | Op-20 | 17 | 20.96 | 20.370 | 0.853698 | 21.515356 | 19.224644 | False |
| 416 | Op-20 | 18 | 19.68 | 20.362 | 0.861464 | 21.517775 | 19.206225 | False |
| 417 | Op-20 | 19 | 19.19 | 20.098 | 0.996454 | 21.434883 | 18.761117 | False |
| 418 | Op-20 | 20 | 21.60 | 20.146 | 1.075119 | 21.588423 | 18.703577 | True |
| 419 | Op-20 | 21 | 21.47 | 20.580 | 1.086163 | 22.037241 | 19.122759 | False |
420 rows × 8 columns
Summary of Project
This project focuses on monitoring and controlling a manufacturing process using Statistical Process Control (SPC). By applying SQL window functions and nested queries, I calculated the Upper Control Limit (UCL) and Lower Control Limit (LCL) for part measurements. The goal was to identify any deviations from the acceptable range to ensure high-quality production. Alerts were generated for parts exceeding the control limits, providing valuable insights for maintaining smooth and efficient manufacturing operations.