Hotel Operations

For this project, LuxurStay Hotels, a major international hotel chain catering to both business and leisure travelers, has always taken pride in their high level of customer service. However, recently there has been a rise in complaints about slow room service at certain branches, which has led to a drop in customer satisfaction ratings. The management, aiming to maintain their expected 4.5 rating, has raised this issue as a priority.
I’m currently collaborating with the Head of Operations to investigate the potential causes of these delays and identify which hotel branches are experiencing the most significant problems.
To learn more about me and my work, expand the ABOUT ME section.
ABOUT ME
Learn more about me on my ABOUT page. Below, you can find links to explore more of my projects categorized by topics, access my resume, and contact me.| PROJECTS | RESUME | CONTACT |
Data
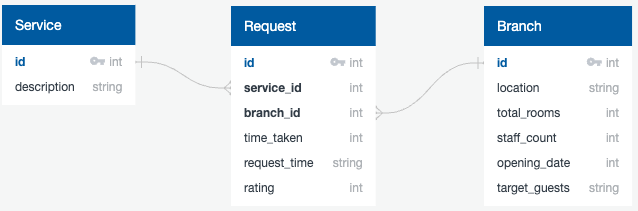
The following schema diagram shows the tables available. You have only been provided with data where customers provided a feedback rating.
Cleaning the Hotel Branch Data
Situation:
The management of LuxurStay Hotels is concerned about customer complaints regarding room service delays. To begin analyzing the data and pinpoint the branches with the worst problems, I was asked to ensure that the data in the branch table is accurate and matches the description provided by the data team.
Task:
My task was to write a query that meets the following criteria:
Each hotel should have a valid identifier (id), and no values should be missing. The location column should only contain four valid categories, with missing values replaced by “Unknown.” The number of rooms in each hotel (total_rooms) must be a positive integer between 1 and 400, with any missing values defaulted to 100. The number of staff employed in the hotel’s service department (staff_count) should reflect a ratio of 1.5 staff per room. The opening_date should be between 2000 and 2023, with missing values defaulted to 2023. The target_guests should be labeled as either “Leisure” or “Business,” with missing values set to “Leisure.”
Action:
To clean and ensure the data is accurate: I wrote a query that retrieved all columns from the branch table. I used conditional logic (CASE statements) to replace any missing or invalid values according to the provided data description. For staff_count, I calculated the correct value by multiplying the total_rooms by 1.5 in case of missing data.
Here’s the query:
1
2
3
4
5
6
7
8
9
10
11
12
13
14
15
16
17
18
19
20
21
22
23
SELECT
	id,
	COALESCE(TRIM(location), 'Unknown') as location,
	COALESCE(NULLIF(total_rooms,0),100) as total_rooms,
	COALESCE(NULLIF(staff_count,0),COALESCE(NULLIF(total_rooms,0),100) * 1.5) as staff_count,
	COALESCE(NULLIF(CAST(opening_date AS integer),0),2023) as opening_date,
	CASE WHEN TRIM(target_guests) IN ('B.', 'Busniess') THEN 'Business'
		 ELSE COALESCE(TRIM(target_guests), 'Leisure')
	END AS target_guests
FROM (
 SELECT
        id,
        location,
        total_rooms,
        staff_count,
        CASE
            WHEN opening_date ~ '^[0-9]+$' THEN CAST(opening_date as integer)
            ELSE NULL
        END AS opening_date,
        target_guests
    FROM
        branch
) AS processed_branch;
Result:
The query successfully returned cleaned data that adhered to the data team’s description, making it ready for further analysis. This ensures that any further investigation into the room service delays is based on accurate and reliable data.
| id | location | total_rooms | staff_count | opening_date | target_guests | |
|---|---|---|---|---|---|---|
| 0 | 1 | LATAM | 168 | 178 | 2017 | Business |
| 1 | 2 | APAC | 154 | 82 | 2010 | Leisure |
| 2 | 3 | APAC | 212 | 467 | 2003 | Leisure |
| 3 | 4 | APAC | 230 | 387 | 2023 | Business |
| 4 | 5 | APAC | 292 | 293 | 2002 | Business |
| ... | ... | ... | ... | ... | ... | ... |
| 95 | 96 | APAC | 237 | 257 | 2000 | Business |
| 96 | 97 | APAC | 107 | 169 | 2005 | Business |
| 97 | 98 | EMEA | 196 | 126 | 2002 | Leisure |
| 98 | 99 | APAC | 242 | 251 | 2021 | Business |
| 99 | 100 | LATAM | 349 | 612 | 2020 | Business |
100 rows × 6 columns
Analyzing Response Times Across Hotel Branches
Situation:
The Head of Operations at LuxurStay Hotels suspects that different branches may take varying amounts of time to respond to customer requests. Given that different services naturally have different response times, they asked me to analyze whether these times differ across branches.
Task:
I was tasked with calculating: The average time taken to respond to a customer request for each service and branch. The maximum time taken to respond to a request for each service and branch. The output needed to include the following columns: service_id: The unique identifier for the service provided. branch_id: The identifier for the hotel branch. avg_time_taken: The average time taken to respond to a customer request, rounded to two decimal places. max_time_taken: The maximum time taken to respond to a customer request, also rounded to two decimal places.
Action:
To complete this task: I used the AVG and MAX functions to calculate the average and maximum response times for each service and branch. I grouped the data by service_id and branch_id to ensure that the calculations were done separately for each service in each branch. I used the ROUND function to ensure the times were rounded to two decimal places, as required.
Here’s the query:
1
2
3
4
5
6
7
8
SELECT
	service_id,
	branch_id,
	ROUND(AVG(time_taken),2) as avg_time_taken,
	ROUND(MAX(time_taken),2) as max_time_taken
FROM request
GROUP BY service_id,
		 branch_id;
Result:
The query returned the average and maximum response times for each service in each branch, providing the Head of Operations with valuable insights into whether certain branches take longer to respond to customer requests. This analysis will allow the operations team to identify where improvements can be made to enhance customer service across different locations.
| service_id | branch_id | avg_time_taken | max_time_taken | |
|---|---|---|---|---|
| 0 | 2 | 46 | 13.09 | 16.0 |
| 1 | 4 | 99 | 9.13 | 13.0 |
| 2 | 1 | 8 | 2.56 | 10.0 |
| 3 | 2 | 13 | 13.53 | 17.0 |
| 4 | 1 | 46 | 2.08 | 4.0 |
| ... | ... | ... | ... | ... |
| 380 | 4 | 73 | 9.43 | 13.0 |
| 381 | 4 | 88 | 9.36 | 12.0 |
| 382 | 1 | 89 | 2.77 | 7.0 |
| 383 | 4 | 31 | 9.00 | 9.0 |
| 384 | 4 | 72 | 9.14 | 11.0 |
385 rows × 4 columns
Focusing on Meal and Laundry Services in Key Regions
Situation:
The management team at LuxurStay Hotels wants to focus on improving the Meal and Laundry services in their branches located in Europe (EMEA) and Latin America (LATAM). They are specifically interested in reviewing the service descriptions, branch details, and customer ratings in these regions to determine where enhancements are needed.
Task:
I was asked to retrieve the following details for services and branches of interest: description: The description of the service (either Meal or Laundry). id: The unique identifier of the branch. location: The region where the branch is located (either EMEA or LATAM). request_id: The ID associated with the service request. rating: The customer rating for the service provided. The goal was to use the original branch table to identify relevant data.
Action:
To complete this task: I wrote a query that filtered the data to include only Meal and Laundry services. I further filtered the results to include only branches located in EMEA and LATAM. I selected the relevant columns to match the management team’s requirements. I ensured the query pulled data from the original branch table, as specified.
Here’s the query:
1
2
3
4
5
6
7
8
9
10
11
12
13
14
SELECT
	s.description as description,
	b.id as id,
	b.location as location,
	r.id as request_id,
	r.rating as rating
FROM request as r
JOIN service as s
	ON r.service_id = s.id
JOIN branch as b
	ON r.branch_id = b.id
WHERE 1=1
	AND (s.description = 'Meal' or s.description = 'Laundry')
	AND (b.location = 'EMEA' or b.location = 'LATAM');
Result:
The query successfully returned a list of Meal and Laundry service requests from branches located in Europe (EMEA) and Latin America (LATAM). This data gave the management team clear insight into the performance of these services and helped them identify areas needing improvement.
| description | id | location | request_id | rating | |
|---|---|---|---|---|---|
| 0 | Laundry | 63 | EMEA | 3 | 4 |
| 1 | Laundry | 69 | LATAM | 6 | 5 |
| 2 | Meal | 44 | EMEA | 18 | 4 |
| 3 | Laundry | 57 | LATAM | 19 | 3 |
| 4 | Meal | 1 | LATAM | 21 | 4 |
| ... | ... | ... | ... | ... | ... |
| 5042 | Meal | 30 | EMEA | 17662 | 4 |
| 5043 | Meal | 64 | LATAM | 17669 | 4 |
| 5044 | Meal | 51 | LATAM | 17674 | 5 |
| 5045 | Meal | 23 | EMEA | 17681 | 5 |
| 5046 | Meal | 41 | LATAM | 17682 | 4 |
5047 rows × 5 columns
Identifying Low-Performing Hotels
Situation:
The management at LuxurStay Hotels has set a target for customer satisfaction, aiming for an average rating of 4.5 or higher. However, there are some hotels where the average rating is falling below this target, and the operations team wants to identify which branch and service combinations are underperforming.
Task:
I was tasked with retrieving the following information for services and branches that have an average rating lower than the target: service_id: The unique identifier for the service. branch_id: The unique identifier for the hotel branch. avg_rating: The average rating for the service and branch combination, rounded to 2 decimal places. The goal was to focus on services and branches where the average rating is below 4.5.
Action:
To address this task, I: Wrote a query to calculate the average rating for each combination of service and branch. Filtered the data to include only those combinations where the average rating is below 4.5. Ensured that the results were rounded to two decimal places for clarity.
Here’s the query:
1
2
3
4
5
6
7
8
9
10
11
12
SELECT
	r.service_id as service_id,
	r.branch_id as branch_id,
	ROUND(AVG(r.rating),2) as avg_rating
FROM request as r
JOIN branch as b
	ON r.branch_id = b.id
JOIN service as s
	ON r.service_id = s.id
GROUP BY r.service_id,r.branch_id
HAVING
	AVG(r.rating) < 4.5;
Result:
The query successfully returned the list of services and branches where the average rating was below the target of 4.5. This data allowed the operations team to identify underperforming hotels and focus on improving customer satisfaction at these locations.
| service_id | branch_id | avg_rating | |
|---|---|---|---|
| 0 | 4 | 99 | 3.83 |
| 1 | 2 | 46 | 3.78 |
| 2 | 1 | 8 | 3.64 |
| 3 | 1 | 46 | 3.81 |
| 4 | 3 | 15 | 4.00 |
| ... | ... | ... | ... |
| 210 | 3 | 8 | 3.38 |
| 211 | 1 | 64 | 3.59 |
| 212 | 4 | 88 | 3.60 |
| 213 | 4 | 93 | 3.72 |
| 214 | 4 | 31 | 4.00 |
215 rows × 3 columns